
Using Open|SpeedShop™
Using Open|SpeedShop's CLI
Within a terminal window, enter openss
-cli and hit <Enter>.
This will start Open|SpeedShop's interactive command line
interface.
In this particular example, we are going to gather user time
information from an MPI job (Note: We are going to simulate
an MPI run by oversubscribing our processor).
For demonstration purposes, we are going to gather information
from one of Open|SpeedShop's supported implementations of the
message passing interface - OpenMPI.
We have provided test binaries that can be utilized for our
purposes.
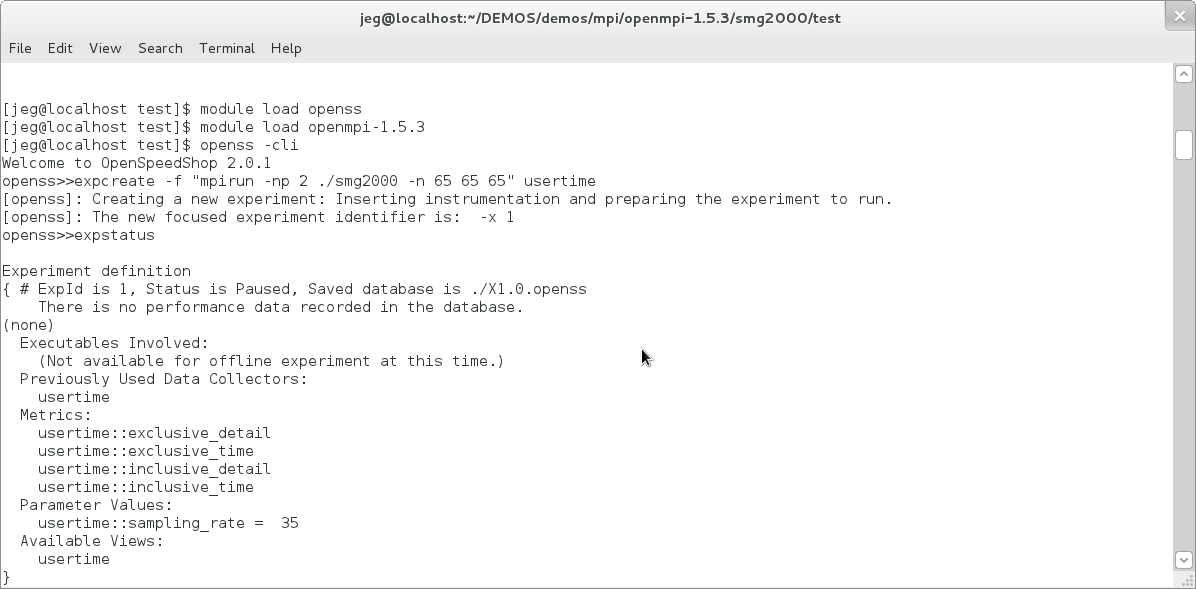
Within the interactive CLI, enter expcreate
-f
"mpirun -np 2 /home/openssuser/mpi/smg2000/test/smg2000"
usertime
Note: In this particular case, the double quotes are
required).
We should then be greeted with a new focused experiment
identifier.
Enter expgo to start the
focused experiment.
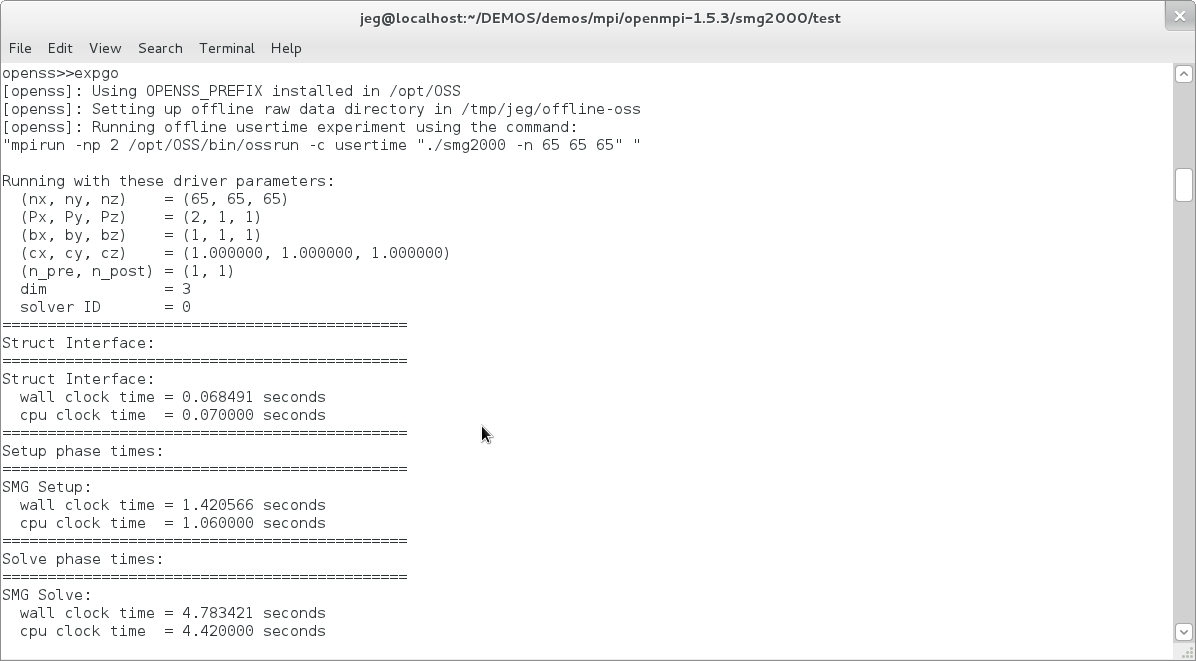
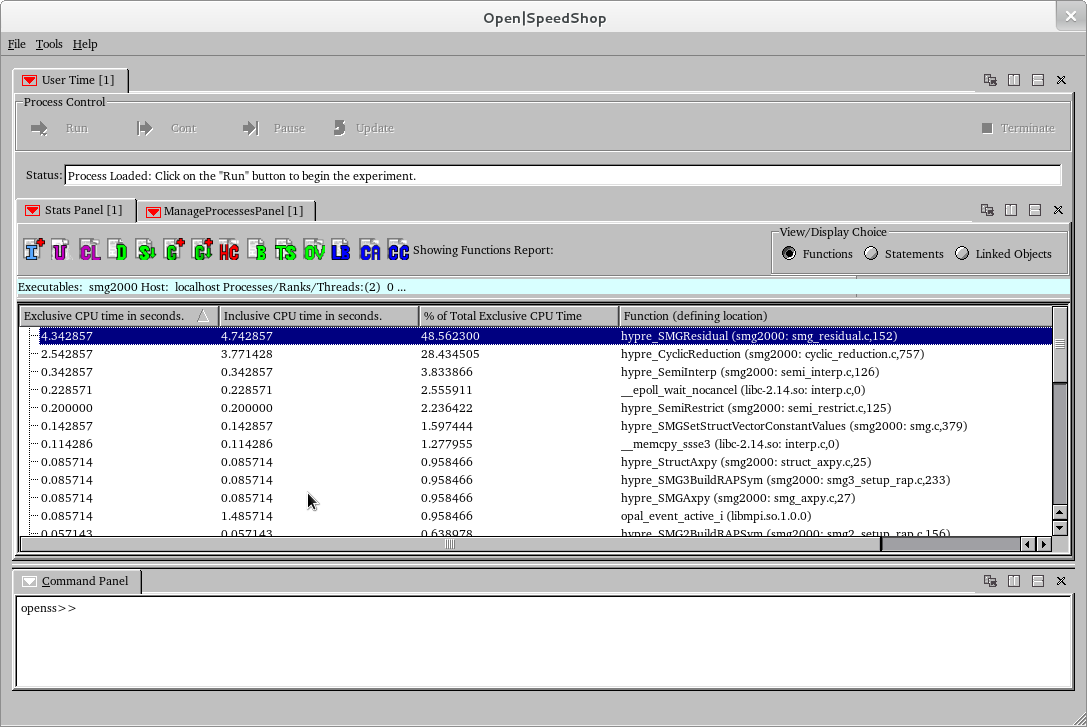
Once the experiment has terminated, we can view the collected
data through the CLI by entering expview,
or we can open the GUI by entering openGui.
Other test binaries are located in
/home/openssuser/sequential/smg2000/test and
/home/openssuser/mpi/smg2000/test and are supplied for further
exploration.
Please also explore the various options offered via a panel's pull
down menu. Further options can be accessed by clicking on a colored
downward-facing arrow.
There are alternative views of the gathered usertime
data. The following slides show these alternative views.
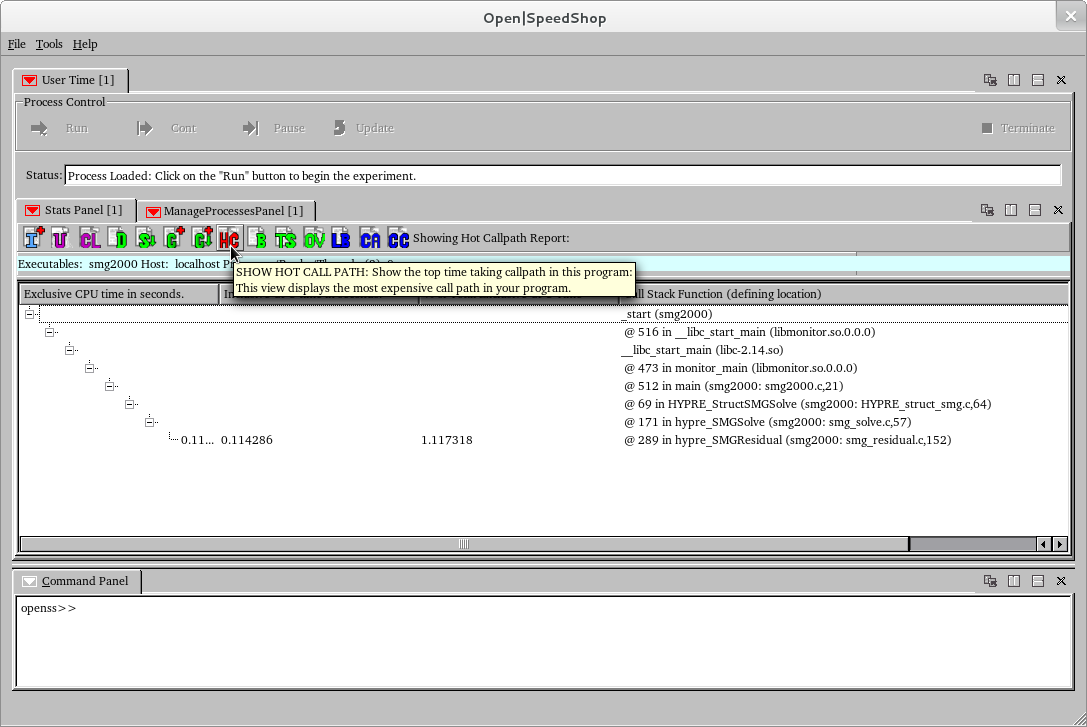
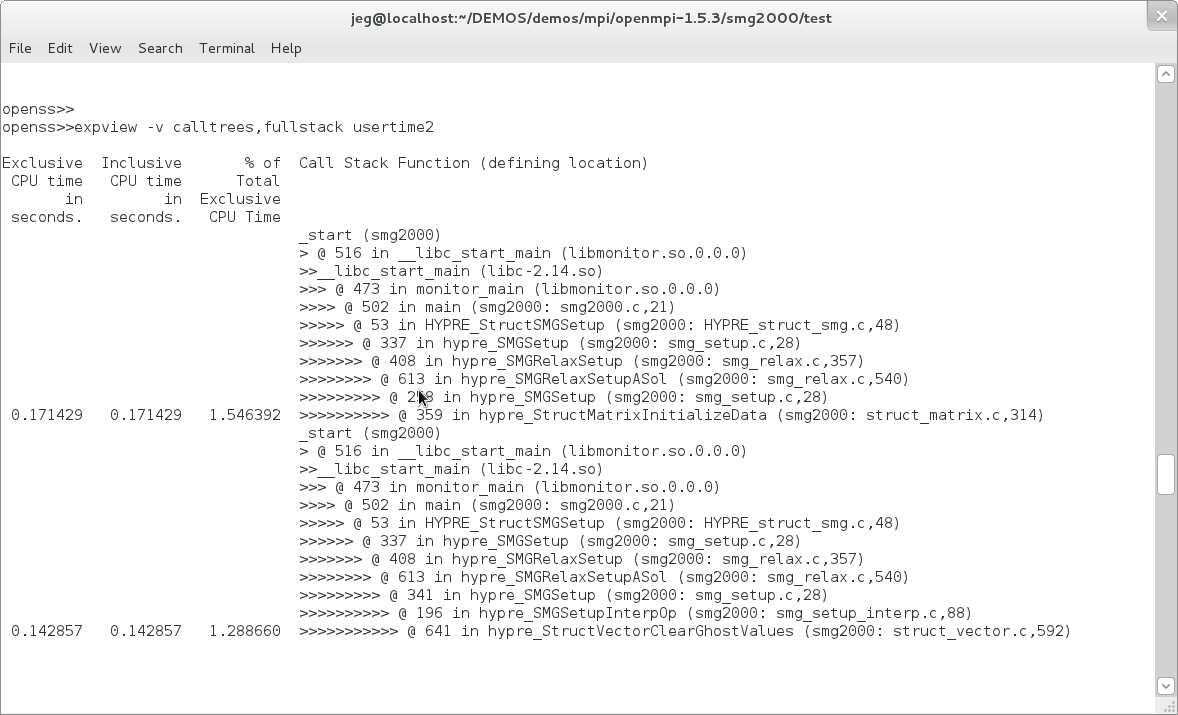
Here we examine the hot call path in the program by clicking on the
HC StatsPanel Icon.
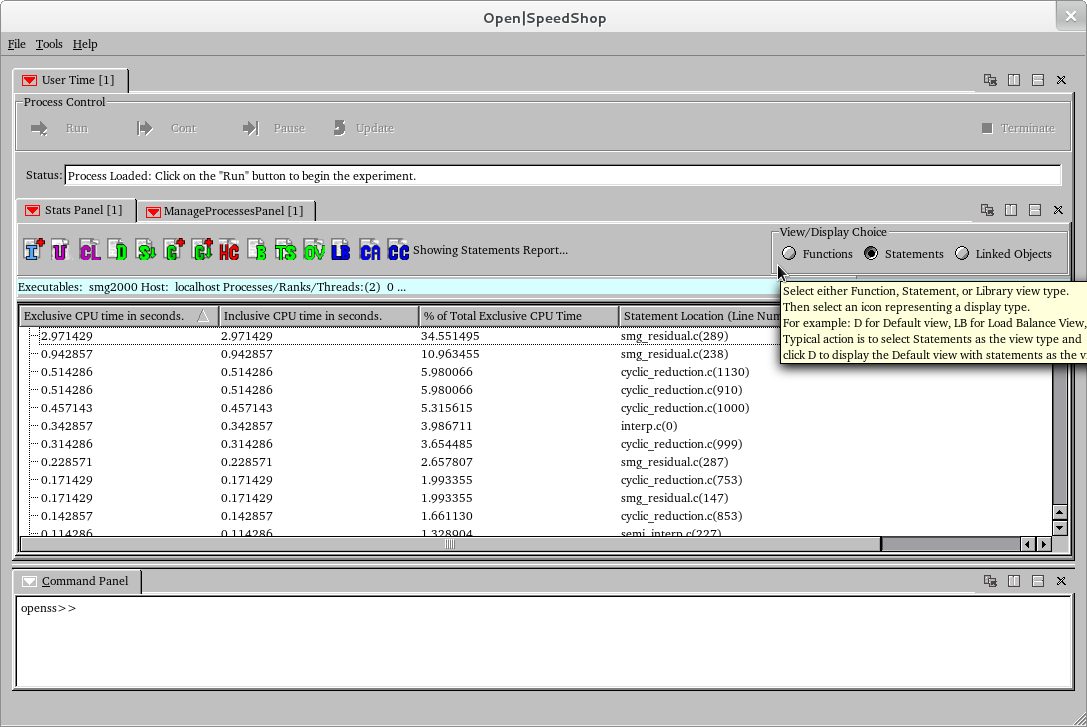
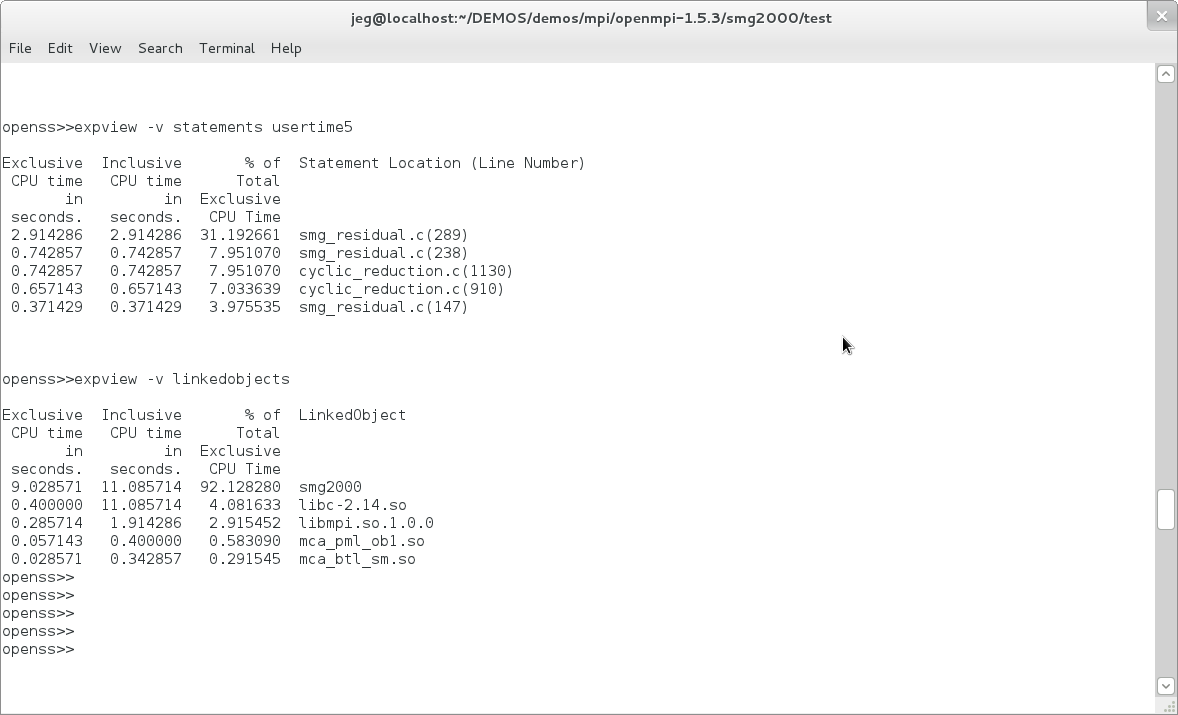
In this view we show the performance data listed per program
statement. Do this by clicking on the "S" icon.
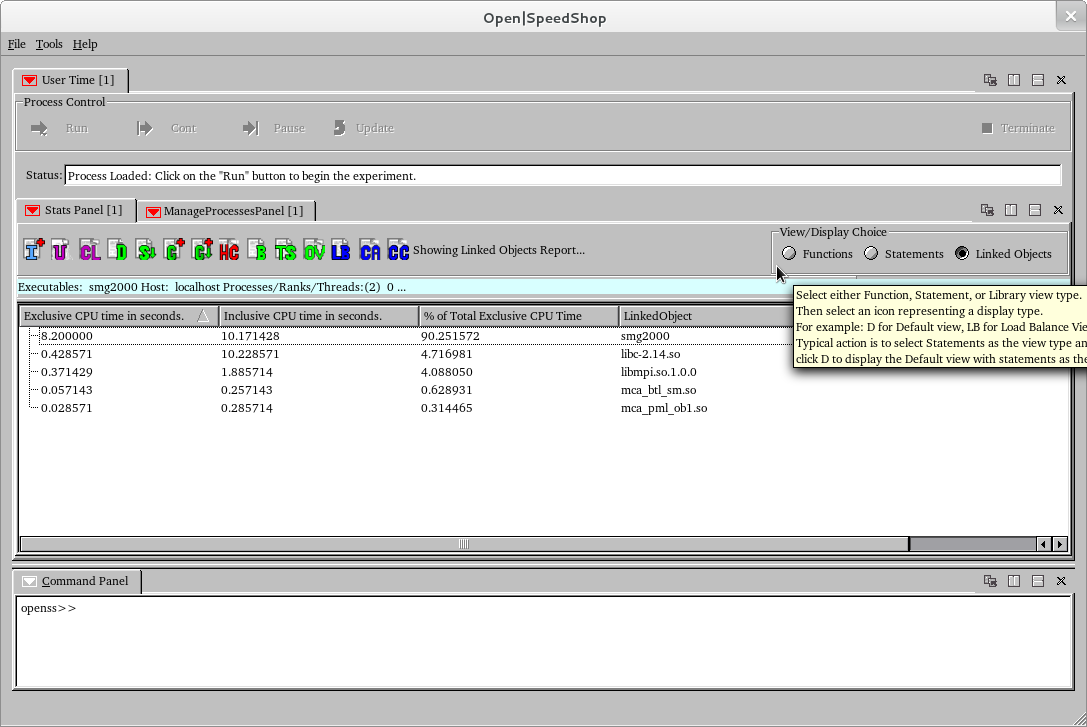
Sometimes it may be beneficial to see where the overall time is
being spent. Here the performance data is shown per
linked or program object.
Show this by clicking on the "L" icon.
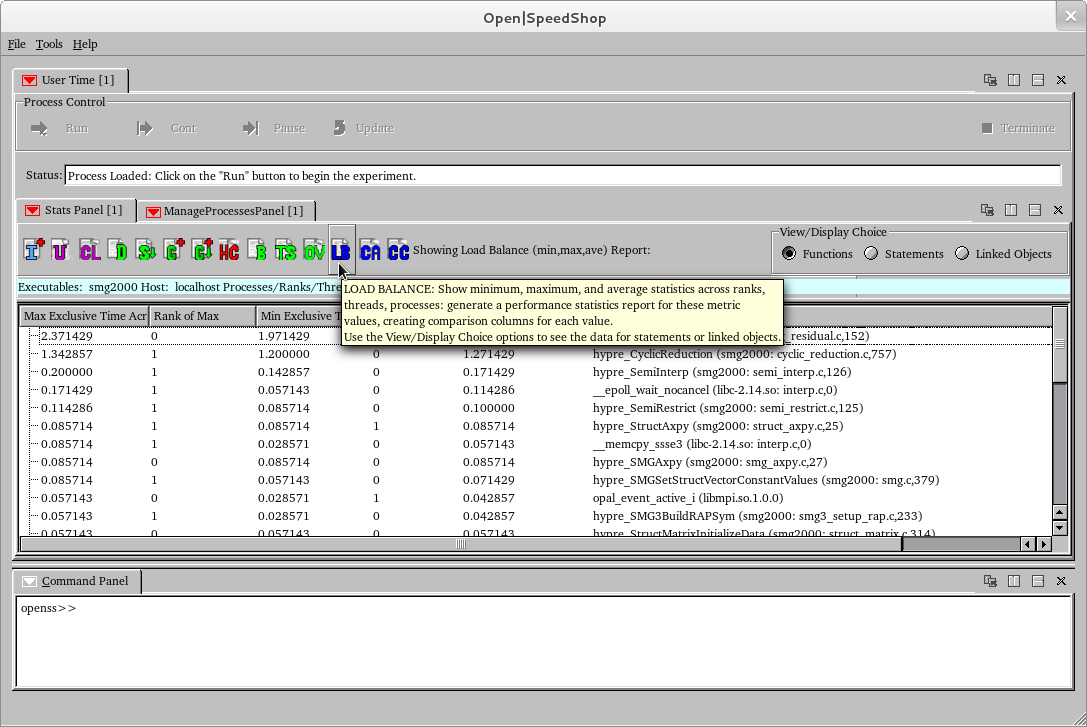
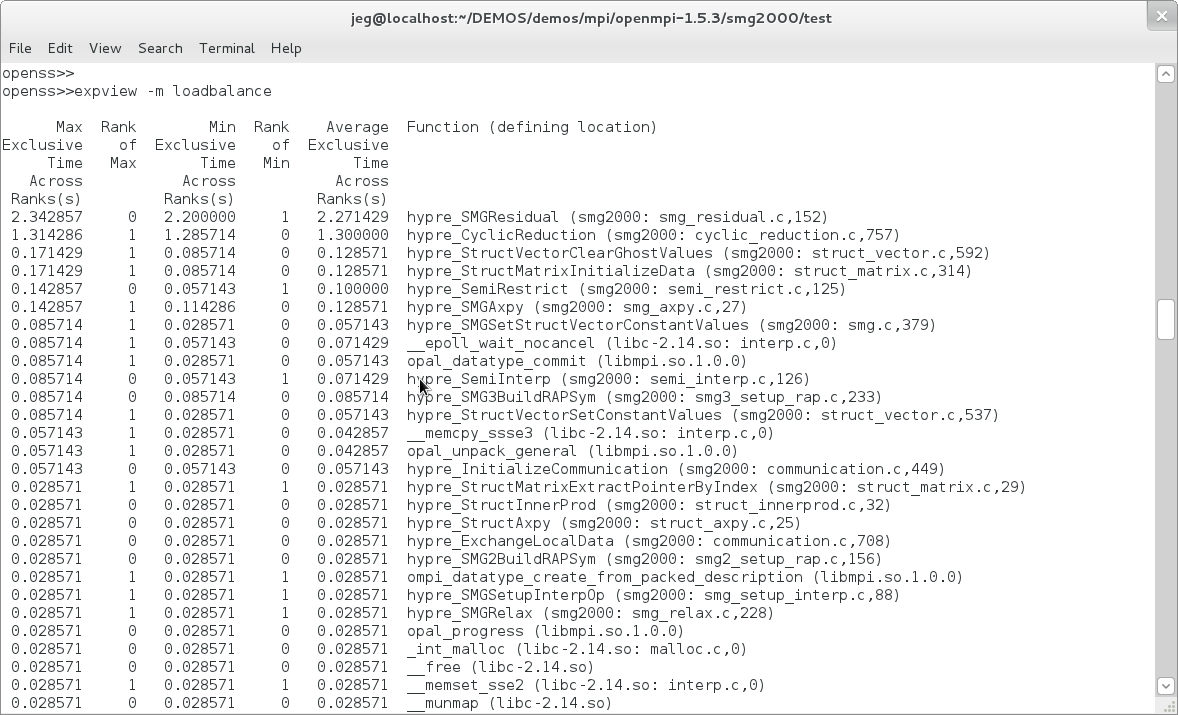
In this view the minimum, maximum, and average values are shown as
computed across the threads, processes, or ranks of an
application.
To see this view click on the "LB" icon.
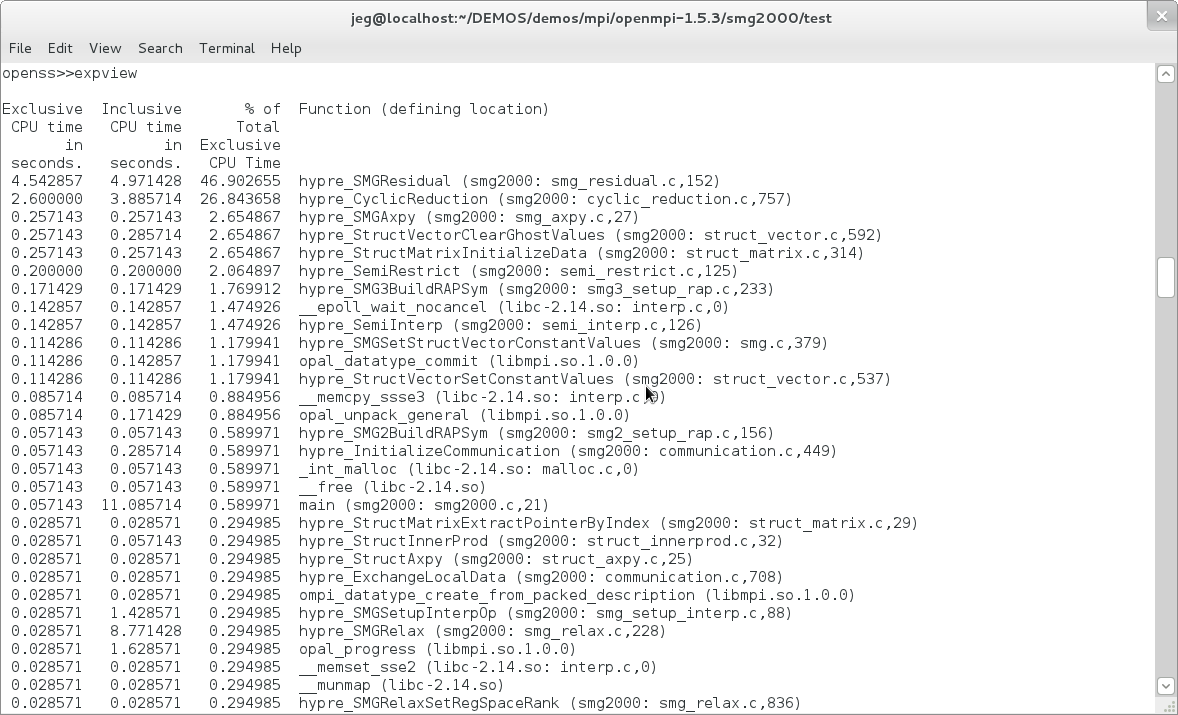
Now, after selecting the Close menu iten in the File Menu in the
GUI, we remain active in the CLI. Here we show the same
results that we obtained in the GUI
can be shown via commands entered into the interactive CLI
tool. Here the expview command gives the default view
similar to the GUI default view.
The load balance option shows the min, max, average time across all
ranks in the program.
This shows the two callpaths in the program that took the most time.
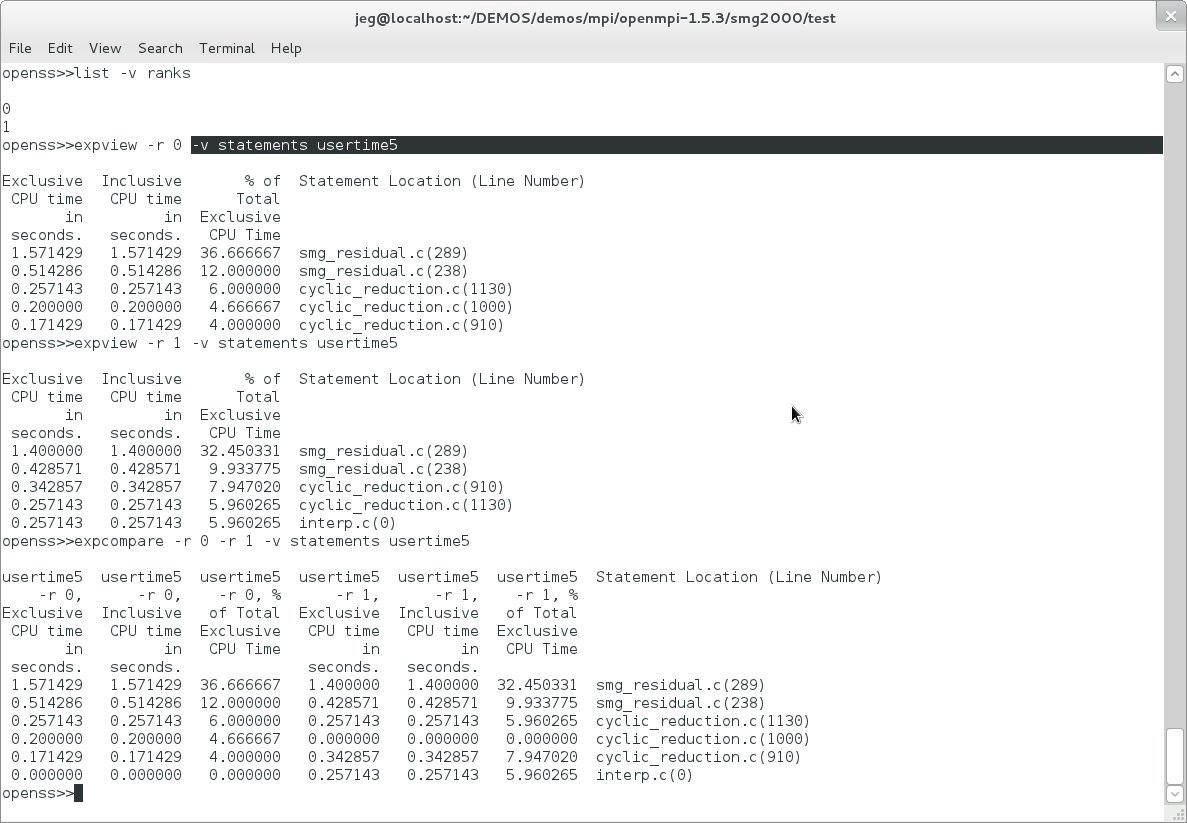
The "-v statements" phrase tells the CLI to display per statement
information about the experiment.
usertime5 tells the CLI to only show the top 5 time critical
statements.
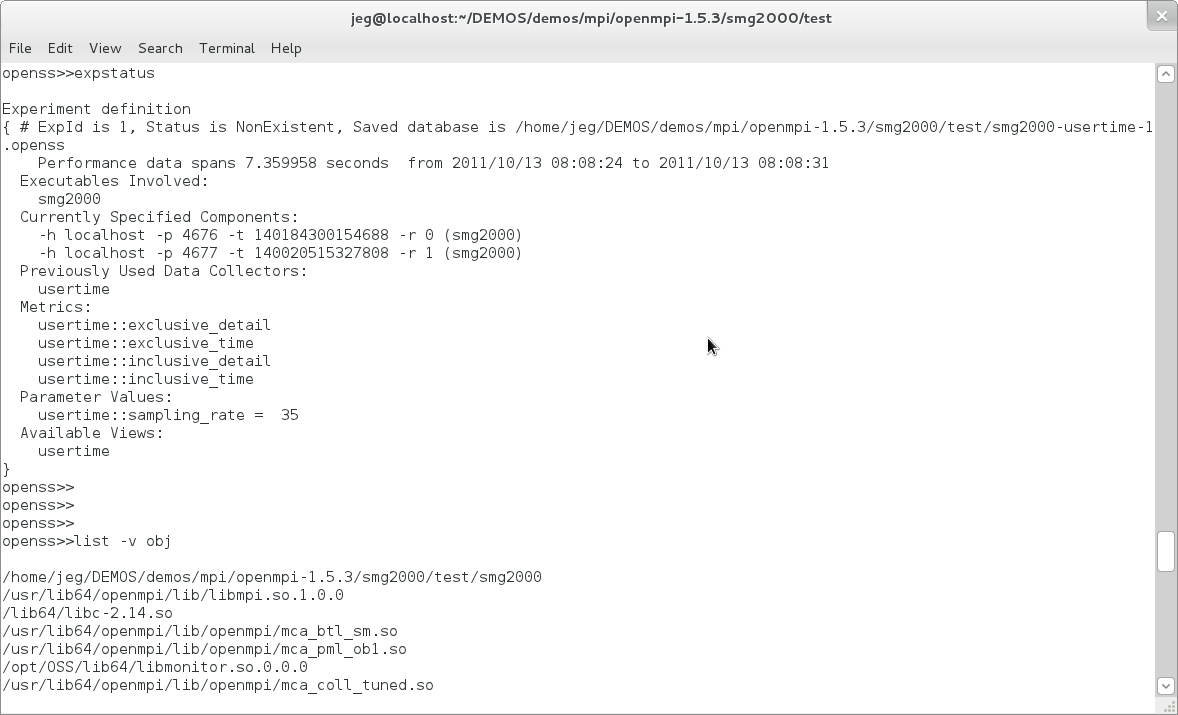
Get the experiment status after the run is complete. It now
has more information than the expstatus we did after expcreate and
before expgo.
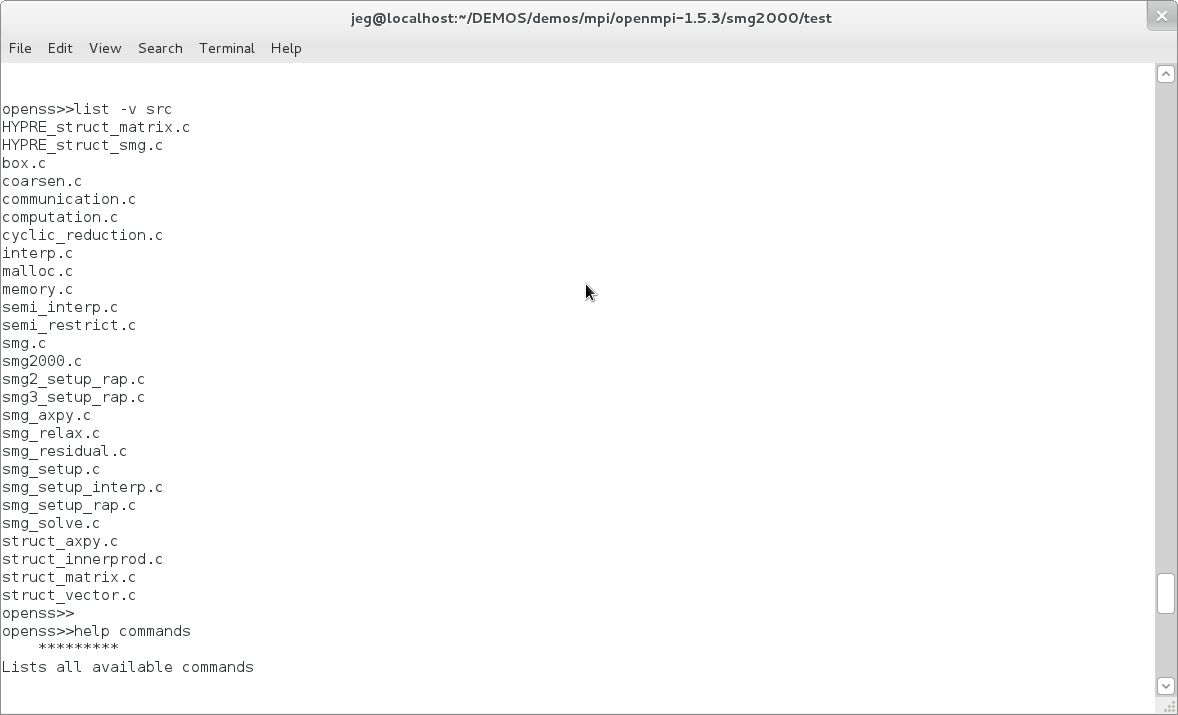
Also, list the libraries involved in the experiment.
Here we list the source files that had performance information.
Here we list information for only one rank at a time and then
compare the rank information using the expcompare command.
Thanks!
Please visit the Open|SpeedShop forum if you have questions: Open|SpeedShop
Forum.
Back To Getting Started With Open|SpeedShop